Bar Graph: Export Statistics of Basmati Rice from India
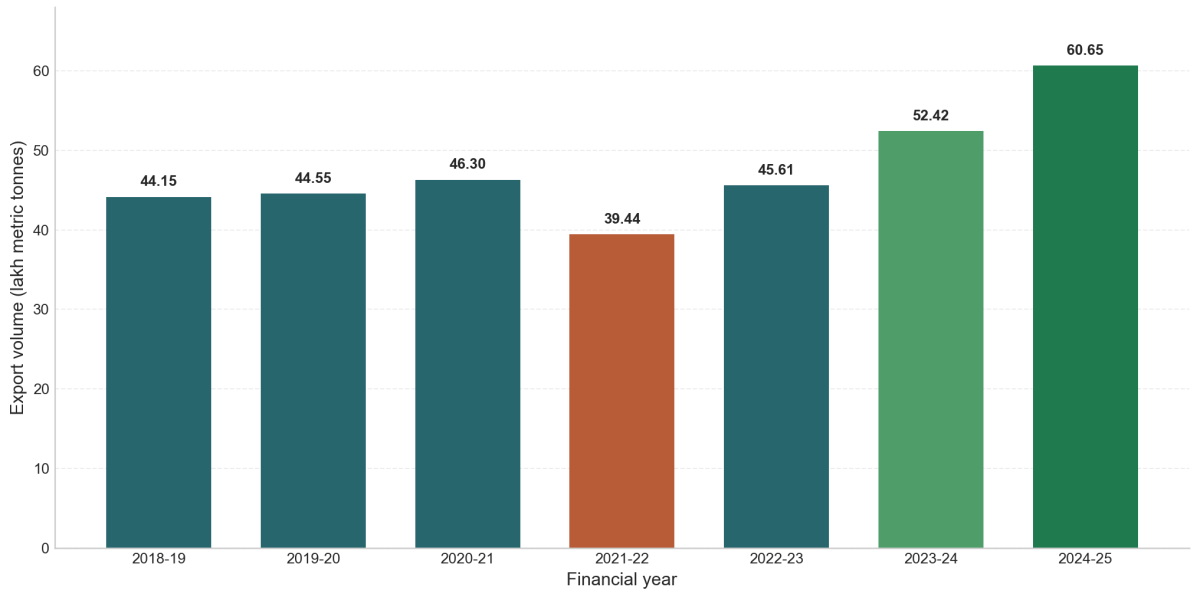
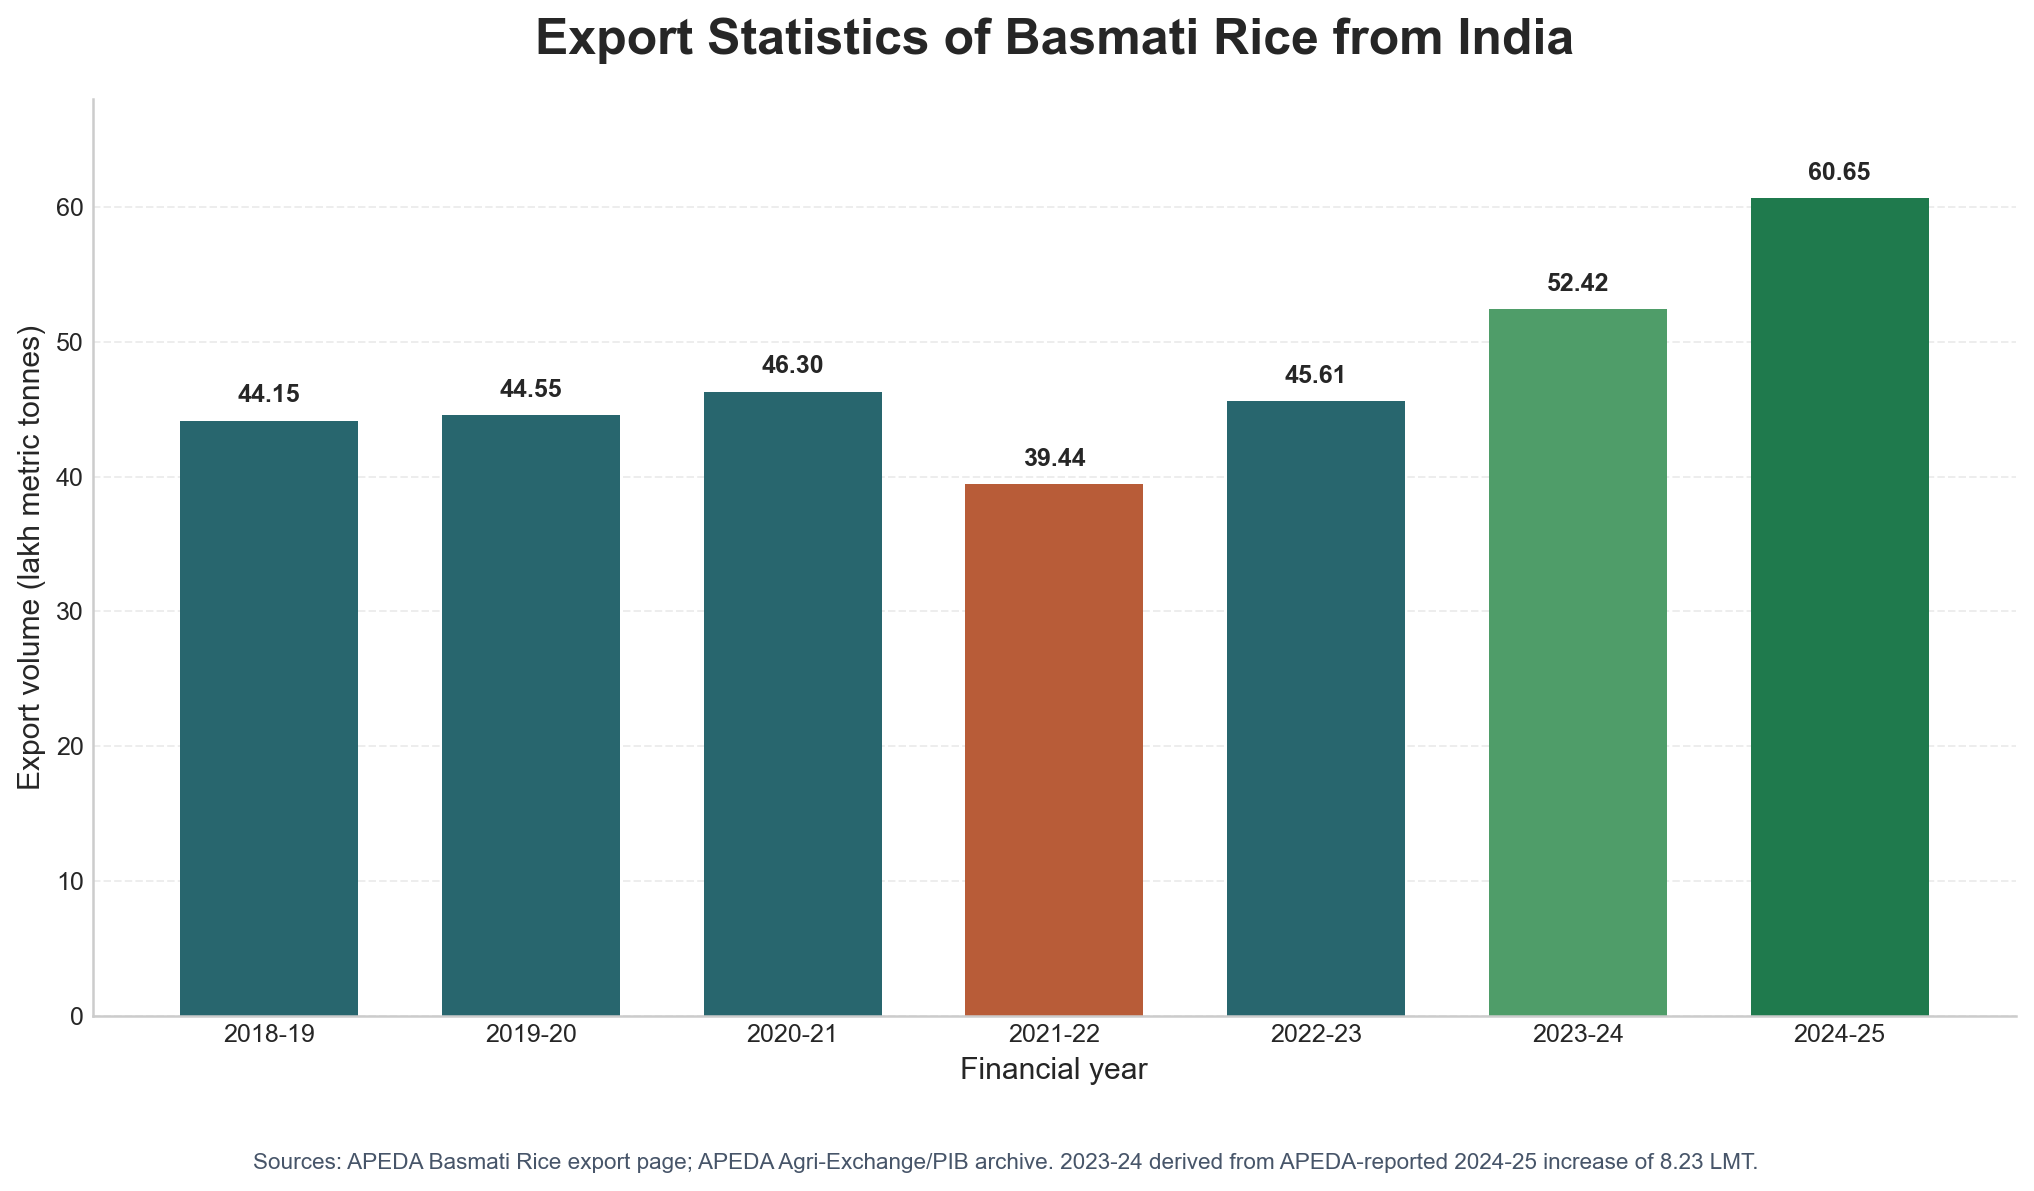
India’s Basmati rice exports show a strong recovery after the 2021-22 dip. Export volume rose from 39.44 LMT in 2021-22 to about 60.65 LMT in 2024-25, the highest point in this seven-year series.
| Financial year | Export volume (LMT) |
|---|---|
| 2018-19 | 44.15 |
| 2019-20 | 44.55 |
| 2020-21 | 46.30 |
| 2021-22 | 39.44 |
| 2022-23 | 45.61 |
| 2023-24 | 52.42 |
| 2024-25 | 60.65 |
Key observation
The latest APEDA figure for 2024-25 reports 6,065,483.45 MT of Basmati rice exports, equivalent to about 60.65 lakh metric tonnes. The 2024-25 volume was about 8.23 LMT higher than 2023-24, indicating a sharp year-on-year increase in shipment volume.
Sources
- APEDA Basmati Rice export statistics, 2024-25.
- APEDA Agri-Exchange / PIB archive for historical Basmati export volumes.
Written by
Dr. B.K. Hooda
Professor of Statistics & Head, Dept. of Mathematics & Statistics, CCS HAU Hisar.
← Previous
Principal Variables as an Alternative to Principal Components for Trait Selection in Agricultural Research (Part-II)
Next →
Bar Diagrams: All India Area, Production and Yield of Wheat