Dynamics of Inter-District Developmental Disparities in Haryana
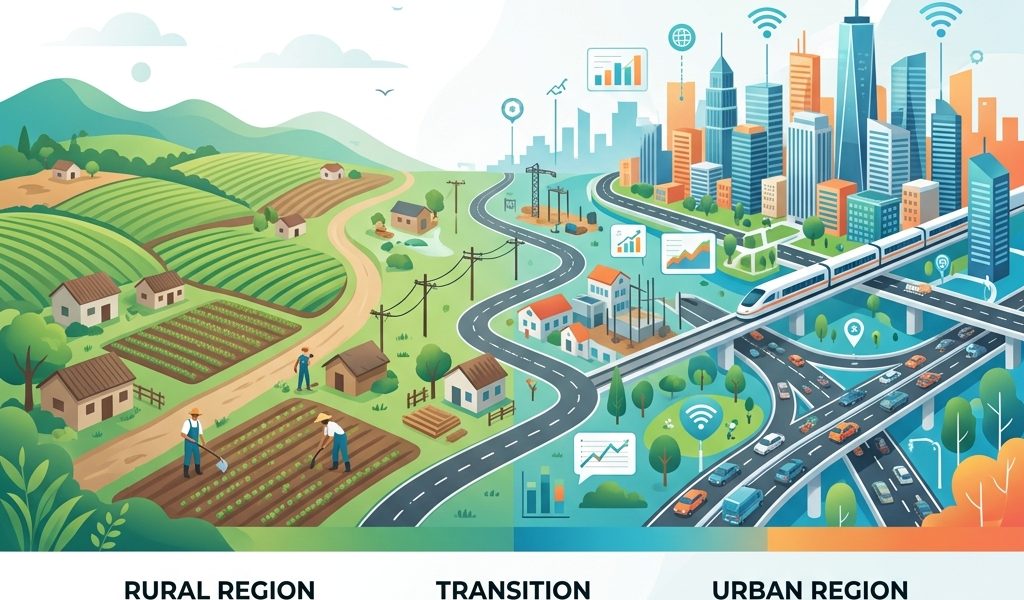
Unpacking Haryana’s Growth Story: The Dynamics of Inter-District Developmental Disparities
While the agricultural sector often brings to mind discussions of crop yields, genetic improvements, and market prices, its vitality is inextricably linked to the broader socioeconomic fabric of a region. True agricultural prosperity doesn’t flourish in isolation; it requires a robust ecosystem of infrastructure, education, health, and economic opportunity. This holistic view is precisely what underpins crucial research into the dynamics of inter-district developmental disparities, offering profound insights into how regional growth unfolds over time.
In the context of a rapidly developing state like Haryana, understanding these intricate patterns of growth and unevenness is not just an academic exercise – it’s a strategic imperative. The state, often dubbed the “breadbasket of India,” has witnessed significant economic transformation, yet this progress hasn’t always been uniformly distributed. For policymakers, researchers, and anyone invested in sustainable development, charting these disparities is the first step towards fostering equitable and resilient growth across all districts.
Why Inter-District Disparities Matter: Beyond the Headlines
Haryana stands as a testament to India’s agricultural prowess and economic dynamism. Situated strategically, bordering the National Capital Region (NCR), it has leveraged its fertile plains and proximity to major markets to become a leading producer of various crops and a hub for industrial and service sectors. However, beneath the impressive growth figures lies a more complex reality: the varying pace of development across its districts.
These developmental disparities are not mere statistical anomalies; they represent real-world challenges. Uneven growth can lead to:
- Resource Misallocation: Without precise data, resources might be distributed inefficiently, either over-investing in already developed areas or under-serving lagging regions.
- Social Inequality: Gaps in education, healthcare, and infrastructure can perpetuate cycles of poverty and limit opportunities for significant segments of the population.
- Economic Instability: A state where some districts thrive while others stagnate can create internal migration pressures, strain social services, and even lead to social unrest.
- Hindered Agricultural Progress: Districts lacking critical infrastructure like reliable electricity, irrigation, and access to markets will inevitably lag in agricultural productivity and farmer income, regardless of crop genetics or best practices. For instance, understanding district-specific challenges is key to effectively implementing strategies for improving yields, an area where statistical tools like GGE Biplot Analysis are typically used at a different scale but share the principle of identifying varying performance across environments.
- Inaccurate Policy Formulation: A ‘one-size-fits-all’ policy approach fails when developmental levels vary significantly. Understanding specific district profiles allows for targeted, effective interventions.
This makes the study of regional inequalities a cornerstone of effective governance and sustainable development planning. It’s about ensuring that the benefits of progress reach every corner and every citizen, fostering an environment where all districts can contribute to and benefit from the state’s overall growth trajectory.
Dr. B.K. Hooda’s Seminal Work: Illuminating Haryana’s Development Landscape
At the forefront of dissecting these complex developmental patterns is the meticulous work of Dr. B.K. Hooda. His research on the dynamics of inter-district developmental disparities in Haryana provides a vital statistical compass for navigating the state’s diverse growth experiences. Dr. Hooda’s contribution extends beyond just identifying disparities; his methodology allows for an in-depth understanding of how these differences evolve over time – whether they narrow, widen, or shift in character. For more details on his extensive background and contributions to agricultural statistics and economics, you can read more About Dr. B.K. Hooda.
His work moves beyond simplistic economic indicators, embracing a more nuanced, multi-dimensional approach to development. By constructing composite indices that integrate a wide array of factors, Dr. Hooda provides a robust framework for assessing and comparing the developmental status of different regions. This approach is critical for state planners who require comprehensive, evidence-based insights to allocate resources effectively and pursue truly balanced regional growth across Haryana.
The Methodology: Constructing a Composite Index of Development
To accurately capture the multi-faceted nature of development, Dr. Hooda’s research employs a sophisticated methodological framework centered on the creation of composite indices. This approach is far more insightful than relying on single indicators, which can often present a skewed or incomplete picture.
Aggregating Diverse Indicators: A Holistic Approach
The foundation of the research lies in meticulously selecting and aggregating a wide range of indicators categorized into key developmental dimensions:
- Agricultural Indicators: These capture the health and productivity of the primary sector. Examples often include:
- Gross Cropped Area per capita
- Irrigation intensity (net irrigated area as a percentage of net sown area)
- Yields of major crops (e.g., wheat, rice)
- Fertilizer consumption per hectare
- Farm mechanization levels (e.g., tractor density)
- Crop diversification index
- Institutional credit to agriculture
- Infrastructural Indicators: These reflect the foundational facilities essential for economic activity and quality of life. Key examples include:
- Road density (km of road per sq. km)
- Railway network density
- Access to electricity (villages electrified, domestic connections)
- Telecommunication density (telephone/internet subscribers)
- Banking facilities (number of bank branches per capita)
- Storage capacity (e.g., cold storage, godowns)
- Socioeconomic Indicators: These delve into human development and economic well-being. Common indicators include:
- Literacy rates (overall, male, female)
- Education access (schools per 1000 population, enrollment ratios)
- Health infrastructure (hospitals, primary health centers, doctor-to-population ratio)
- Poverty ratios
- Per capita income/Net District Domestic Product (NDDP)
- Access to safe drinking water and sanitation
- Urbanization rate
Statistical Techniques: The Art of Aggregation and Analysis
Once the raw data for these indicators is collected across various districts and time periods, the next critical step is to normalize and combine them into a meaningful composite index. This typically involves several statistical techniques:
- Data Normalization: Indicators often have different units of measurement and scales (e.g., percentages, absolute numbers, ratios). To ensure comparability, each indicator is normalized. Techniques like min-max scaling or Z-score standardization are commonly employed to bring all values to a common scale.
- Weighting: Deciding the relative importance of each indicator in the composite index is crucial. Dr. Hooda’s work likely employs sophisticated statistical methods to derive these weights rather than relying on arbitrary assumptions. Techniques such as Principal Component Analysis (PCA) or Factor Analysis are often utilized. These methods identify underlying dimensions (components/factors) that explain the maximum variance in the data, with the factor loadings or component scores determining the weights. This mirrors the advanced statistical approaches used in other agricultural studies, such as the Principal Component Approach for Estimating Cotton Yield, highlighting a common thread in data-driven agricultural research.
- Aggregation: After normalization and weighting, the indicators are aggregated to form a single composite development index for each district at each point in time. This index provides a single numerical value representing the overall developmental status.
- Temporal Analysis: The “dynamics” aspect is crucial. By constructing these indices for multiple time points (e.g., every five years), the research can track the evolution of disparities. Statistical tools like growth rates, coefficient of variation, and Gini coefficients can then be applied to the composite index values to quantify whether disparities have narrowed, widened, or remained stable over specific periods. This longitudinal analysis provides invaluable insights into the efficacy of past policies and the emergent trends.
This rigorous methodological framework ensures that the findings are not only statistically sound but also comprehensively reflect the complex reality of regional development.
Key Statistical Insights and Findings from Haryana
Dr. Hooda’s research, meticulously tracing developmental trends over several decades, reveals compelling insights into Haryana’s progress. While specific numerical findings would be detailed in the original papers, the general patterns observed in such studies often highlight:
Persistent Pockets of Underdevelopment
Despite overall economic growth, certain districts consistently lag behind the state average across multiple developmental dimensions. These often include areas with limited natural resources, poor historical infrastructure investment, or distance from major economic centers like the NCR. The analysis can pinpoint exactly which dimensions (e.g., education, health, agricultural productivity) are most critical in these lagging districts.
Emergence of New Growth Poles
Conversely, some districts experience rapid advancement, often driven by proximity to urban hubs, specific government industrial policies, or concentrated agricultural investments (e.g., better irrigation networks, processing units). The research can track how these ‘growth poles’ emerge and influence the surrounding regions.
Varying Trajectories of Disparity
The dynamics reveal that disparities are not static. In some periods, state policies or economic shifts might lead to a narrowing of gaps, especially in basic infrastructure or literacy. However, in other periods, perhaps due to intensified industrialization in specific zones, the disparities might widen, particularly in terms of income and access to advanced services. This oscillation underscores the need for continuous monitoring and adaptive policy responses.
The Role of Agriculture in Shaping Development
A critical takeaway for our audience in agricultural statistics is the undeniable influence of the agricultural sector on overall district development. Districts with higher agricultural productivity, better access to markets, advanced irrigation, and diversified farming practices often demonstrate higher socioeconomic indicators. Conversely, regions heavily reliant on rain-fed agriculture or traditional practices frequently struggle, impacting education, health, and income levels. This highlights that agricultural interventions are not just about food security but are powerful levers for holistic regional development. For a deeper dive into the specific dynamics of inter-district developmental disparities in Haryana, the full research offers comprehensive details, which can be found in Dr. Hooda’s dedicated section on Developmental Disparities in Haryana.
Implications for Policy, Planning, and Practice
The statistical insights derived from studies like Dr. Hooda’s are not merely academic curiosities; they are foundational for evidence-based policy formulation and effective resource allocation.
Targeted Resource Allocation
Understanding which districts are lagging and in what specific areas allows state planners to move beyond uniform budget allocations. Instead, resources can be strategically channeled to address critical deficiencies, whether in agricultural infrastructure, educational facilities, or healthcare services. This ensures that investments yield maximum impact where they are most needed.
Formulating Differentiated Development Strategies
The research provides the granularity needed to formulate district-specific development plans. A strategy suitable for an industrially developed district might be wholly inappropriate for a predominantly agricultural, underdeveloped region. Policies can be tailored to leverage local strengths and address unique challenges, promoting diversified growth paths.
Monitoring and Evaluation Frameworks
The methodology of composite indices and temporal analysis offers a powerful framework for ongoing monitoring and evaluation of development initiatives. Policymakers can track changes in the composite index and its underlying indicators to assess the effectiveness of interventions and make necessary adjustments in real-time.
Informing Agricultural Development Programs
For the agricultural sector, these findings underscore the need for a spatially differentiated approach to development programs. Initiatives focusing on irrigation expansion, crop diversification, market linkages, and agricultural extension services can be targeted to districts where they will have the greatest impact on reducing overall developmental disparities. Such detailed analysis can often benefit from expert guidance, and our Consulting Services can assist organizations in applying similar rigorous statistical frameworks to their own data and policy challenges.
Challenges and Future Research Avenues
While Dr. Hooda’s research provides an invaluable foundation, the field of developmental disparities is continuously evolving.
- Data Granularity and Availability: A persistent challenge remains the availability of reliable, up-to-date data at the sub-district or block level, which could offer even finer insights into local disparities.
- Incorporating New Dimensions: Future research could incorporate indicators related to environmental sustainability, climate change vulnerability, and digital connectivity, which are increasingly critical for holistic development.
- Causal Analysis: Moving beyond descriptive analysis, future studies could focus more on establishing causal links between specific policies or external shocks and changes in developmental disparities.
- Inter-State Comparisons: Extending the methodology to compare Haryana’s performance with other Indian states could provide a broader comparative context.
Scholars and practitioners interested in delving deeper into these methodologies and findings, or exploring related areas of study, are encouraged to review his broader body of work and other contributions, accessible via our Research & Publications section.
Conclusion: A Blueprint for Equitable Growth in Haryana
The dynamics of inter-district developmental disparities in Haryana, as illuminated by the pioneering work of Dr. B.K. Hooda, offer a critical lens through which to view the state’s progress. By meticulously constructing composite indices and tracking their evolution over time, this research transcends superficial observations, providing deep, actionable statistical insights.
For students and scholars in agricultural statistics and data science, this body of work serves as a powerful example of how quantitative methods can be applied to address complex societal challenges. For practitioners and state planners, it is nothing short of a blueprint. It underscores that true progress is measured not just by overall growth rates, but by how equitably that growth is distributed across all regions and communities. Only through a sustained commitment to data-driven policy, guided by robust statistical analysis, can Haryana — and indeed any developing region — hope to achieve balanced, inclusive, and truly sustainable growth for all its citizens, thereby ensuring that its agricultural prosperity is matched by holistic socioeconomic well-being.
B K Hooda
Professor of Statistics & Head, Dept. of Mathematics & Statistics, CCS HAU Hisar.