Estimating Cotton Yield Before Harvest: A Principal Component Approach
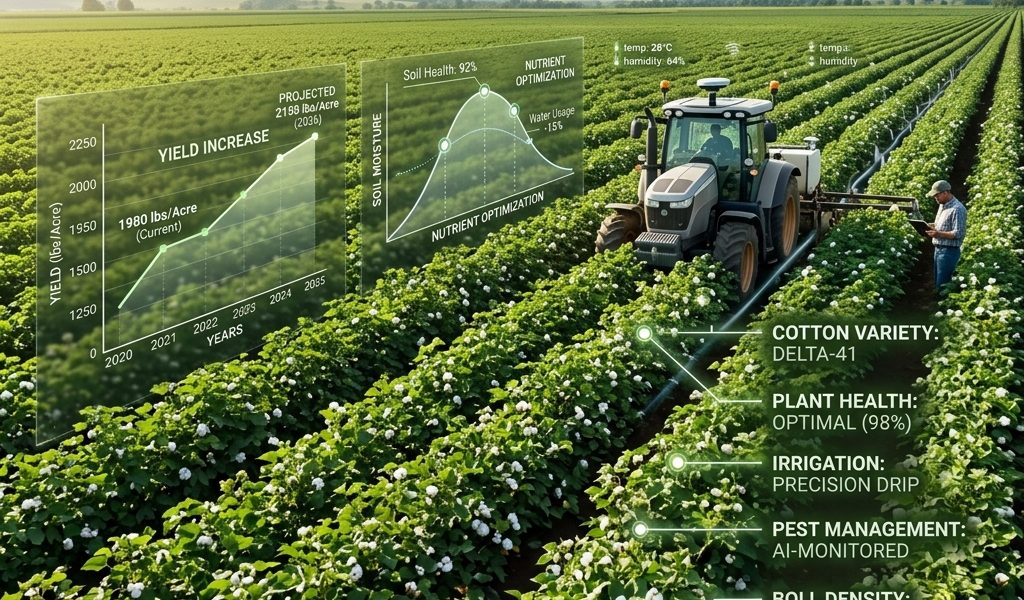
Estimating Cotton Yield Before Harvest: A Principal Component Approach for Precision Agriculture
In the dynamic world of agriculture, few challenges are as critical and complex as accurately predicting crop yields. The ability to forecast yield before harvest empowers policymakers, farmers, and market stakeholders to make informed economic decisions, optimize resource allocation, and mitigate risks. Traditional methods, often relying on historical averages or simplistic visual assessments, frequently fall short in capturing the nuanced interactions of plant growth and environmental factors. This is where advanced statistical methodologies shine, offering a pathway to greater precision and reliability.
A seminal contribution in this field comes from researchers like Dr. B.K. Hooda, whose work explores the powerful application of the Principal Component Technique for pre-harvest estimation of cotton yield. Unlike conventional approaches that might struggle with the sheer volume and interconnectedness of plant data, this method leverages real-time biometrical characteristics—such as plant height, number of bolls, and leaf area—to build a robust predictive model. Given that these biometrical variables are often highly correlated, Principal Component Analysis (PCA) stands out as an exceptionally effective tool. It brilliantly reduces the dimensionality of the data while meticulously retaining the core variance, resulting in a statistically sound and significantly more precise model for estimating cotton yield.
This post will delve deep into the methodology, statistical underpinnings, and profound implications of employing PCA for pre-harvest cotton yield estimation. We aim to provide a comprehensive guide for students, research scholars, and practitioners in agricultural statistics and data science, highlighting how innovative statistical thinking can transform agricultural practices and policy.
The Imperative of Accurate Pre-Harvest Yield Estimation
The agricultural sector operates within a delicate balance of biological processes, economic forces, and environmental variables. For a globally significant crop like cotton, accurate yield forecasting is not merely an academic exercise; it’s a fundamental necessity with far-reaching consequences:
- Market Stability: Reliable yield predictions help stabilize commodity markets by providing early insights into supply, influencing pricing, and reducing speculation.
- Farm Management: Farmers can make better decisions regarding harvesting logistics, labor planning, storage facilities, and marketing strategies. It allows for optimized input use, preventing over or under-application of resources.
- Policy Formulation: Governments and policymakers rely on these estimates for import/export decisions, food security planning (though cotton is not a food crop, its economic impact affects overall agricultural policy), subsidy programs, and disaster relief preparedness.
- Risk Management: Early warnings of potential yield shortfalls or surpluses enable stakeholders to prepare for various scenarios, from price crashes to supply chain disruptions.
Traditional methods, such as farmer surveys, visual assessments, or extrapolations from small sample plots, often suffer from subjectivity, limited scope, and an inability to account for complex interactions between growth factors. Historical trends, while useful, cannot adapt quickly enough to year-to-year variations in weather, pest pressures, or evolving farming practices.
Understanding Cotton: A Crop of Economic Significance
Cotton (Gossypium hirsutum L.) is one of the world’s most important fiber crops, supporting millions of livelihoods globally. Its cultivation is complex, influenced by a multitude of factors ranging from genetic potential and soil characteristics to water availability, nutrient management, pest and disease incidence, and climatic conditions. The final yield, measured in lint per hectare, is the culmination of intricate biological processes occurring throughout the plant’s life cycle.
Given this complexity, a direct, single-variable approach to yield prediction is often insufficient. Many biometrical traits measured during the growth cycle—such as plant height, stem diameter, number of fruiting branches, boll load, and leaf area index—are highly interconnected. A taller plant might have more fruiting branches, which in turn could lead to more bolls, all contributing to a higher potential yield. This intercorrelation, while biologically intuitive, poses a statistical challenge known as multicollinearity, which can inflate variance in regression coefficients and make models unstable. This is precisely where PCA offers a sophisticated solution.
The Statistical Backbone: Principal Component Analysis (PCA) Explained
What is Principal Component Analysis?
Principal Component Analysis (PCA) is a powerful multivariate statistical technique designed to reduce the dimensionality of a dataset while retaining as much of the variance as possible. Developed by Karl Pearson in 1901, PCA achieves this by transforming a set of possibly correlated variables into a smaller set of uncorrelated variables called principal components (PCs).
Each principal component is a linear combination of the original variables. The first principal component (PC1) accounts for the largest possible variance in the data. The second principal component (PC2) accounts for the next largest variance, orthogonal (uncorrelated) to the first, and so on. This process continues until the number of principal components equals the number of original variables, but typically, only the first few PCs, which capture most of the data’s variability, are retained for further analysis.
Why PCA for Biometrical Data?
As discussed, plant biometrical data is inherently prone to multicollinearity. For instance, in cotton, a robust plant with significant leaf area is likely to also exhibit greater plant height and potentially more fruiting points. If we were to use all these highly correlated variables directly in a multiple linear regression model for yield prediction, several issues could arise:
- Unstable Coefficients: Multicollinearity can lead to large standard errors for regression coefficients, making them unreliable and difficult to interpret.
- Redundancy: Highly correlated variables carry similar information, leading to redundancy and an unnecessarily complex model.
- Overfitting: Including too many correlated variables can make the model overfit the training data, performing poorly on new, unseen data.
PCA elegantly bypasses these problems. By transforming the original correlated variables into a set of orthogonal (uncorrelated) principal components, it effectively creates new, independent predictor variables that summarize the essential information from the original dataset. These principal components can then be used as predictors in a subsequent regression model for yield, yielding a more stable, parsimonious, and interpretable model. This method is particularly relevant in agricultural research where traits often exhibit strong genetic and phenotypic correlations, similar to the multi-environment trial analysis discussed in GGE Biplot Analysis.
The Mechanics of PCA in Practice
The core of PCA involves calculating eigenvalues and eigenvectors from the covariance or correlation matrix of the original variables. Eigenvectors represent the directions (or components) in which the data varies the most, while eigenvalues quantify the amount of variance explained by each eigenvector.
- Standardization: Typically, the raw data is standardized (mean-centered and scaled to unit variance) before PCA to prevent variables with larger scales from dominating the components.
- Covariance/Correlation Matrix: This matrix shows the relationships between all pairs of variables.
- Eigen-decomposition: The eigenvalues and eigenvectors are extracted from this matrix.
- Component Selection: Principal components are ranked by their eigenvalues (variance explained). A common practice is to select components that collectively explain a significant proportion (e.g., 70-90%) of the total variance, or by using a scree plot to identify an “elbow” where the additional variance explained by subsequent components drops off sharply.
- Interpretation: Each principal component can often be interpreted in terms of the original variables that load heavily onto it. For instance, PC1 might represent “overall plant vigor” if it has high positive loadings for plant height, leaf area, and stem diameter.
Dr. B.K. Hooda’s Pioneering Approach: A Deep Dive into Methodology
Dr. B.K. Hooda’s work exemplifies the application of PCA to agricultural problems. Known for his contributions to agricultural statistics, particularly in areas requiring robust statistical modeling, Dr. Hooda’s paper on cotton yield estimation provides a clear blueprint for this advanced approach. You can learn more about his background and contributions on the About Dr. B.K. Hooda page and explore his broader academic work via Research & Publications.
Data Collection and Variable Selection
The foundation of any robust statistical model is high-quality data. For cotton yield estimation using PCA, this involves systematic collection of various biometrical characters at different growth stages. Typical variables include:
- Plant Height: An indicator of vegetative growth.
- Number of Sympodial Branches: These are the fruiting branches where bolls develop.
- Number of Bolls per Plant: A direct precursor to yield.
- Boll Weight: The weight of individual cotton bolls.
- Leaf Area Index (LAI): Relates to photosynthetic capacity.
- Dry Matter Accumulation: Total biomass accumulation.
- Stem Diameter: Another indicator of plant vigor and strength.
- Days to First Flowering/Boll Opening: Phenological indicators.
Data must be collected from representative samples across different plots and environments, ensuring a comprehensive dataset that captures the variability inherent in cotton cultivation.
Constructing the Principal Components for Cotton Yield
Once the biometrical data is meticulously collected, the PCA process begins. The steps typically involve:
- Data Preprocessing: Cleaning, handling missing values, and standardizing the data.
- PCA Execution: Applying PCA to the standardized biometrical variables. This yields a set of principal components and their corresponding eigenvalues and eigenvectors.
- Component Selection: Based on eigenvalues and scree plots, a subset of principal components that explain a substantial proportion of the total variance is selected. For example, the first three or four PCs might collectively explain over 80% of the variance in the original biometrical traits.
- Interpretation of PCs: Examining the loading matrix (eigenvectors) helps interpret what each principal component represents. PC1 might capture general plant size and vigor, while PC2 could represent reproductive efficiency, and PC3 might relate to early-season growth.
- Regression Modeling: The selected principal components are then used as independent variables in a regression model (e.g., multiple linear regression) to predict the actual cotton yield (dependent variable). This approach mitigates multicollinearity, providing stable and interpretable coefficients for the principal components.
Model Formulation and Validation
The predictive model, typically a regression equation, takes the form:
Yield = β₀ + β₁PC₁ + β₂PC₂ + ... + βₚPCₚ + ε
Where Yield is the estimated cotton yield, β₀ is the intercept, βᵢ are the regression coefficients for the principal components, PCᵢ are the selected principal components, and ε is the error term.
Crucially, the model must be validated using independent datasets or cross-validation techniques (e.g., k-fold cross-validation) to assess its predictive performance. Key metrics for evaluation include:
- R-squared (R²): Measures the proportion of variance in the dependent variable predictable from the independent variables. A higher R² indicates a better fit.
- Root Mean Square Error (RMSE): Quantifies the average magnitude of the errors. A lower RMSE indicates greater accuracy.
- Mean Absolute Error (MAE): Provides an average of the absolute differences between prediction and actual observation.
Studies employing this approach often demonstrate significantly improved R² values and reduced RMSE compared to models that either use a subset of individual biometrical traits or simple historical averages. This robust statistical validation underscores the power of the PCA methodology.
Unpacking the Benefits: Why This Approach is a Game-Changer
Enhanced Precision and Accuracy
The primary advantage of the PCA approach is the significant boost in prediction accuracy. By addressing multicollinearity and synthesizing information from numerous correlated variables into a few orthogonal components, the resulting regression model becomes more stable and reliable. This leads to more precise yield forecasts with tighter confidence intervals, minimizing the gap between predicted and actual yields. This precision is invaluable for strategic planning.
Data Efficiency and Reduced Complexity
PCA transforms a large, complex set of intercorrelated variables into a smaller, more manageable set of uncorrelated principal components. This not only simplifies the modeling process but also makes the interpretation of underlying biological drivers easier. Instead of grappling with how each of twenty different growth traits individually influences yield, researchers and practitioners can focus on understanding the implications of, say, ‘overall plant vigor’ (PC1) or ‘fruiting potential’ (PC2).
Timely Decision-Making for Farmers and Policymakers
The ability to accurately predict yield weeks or even months before harvest offers a strategic advantage. For farmers, this translates into:
- Optimized Marketing: Deciding when and where to sell cotton based on anticipated supply and demand.
- Resource Allocation: Making timely adjustments to irrigation, fertilization, or pest management based on early yield potential assessments.
- Financial Planning: Securing loans, insurance, or making investment decisions with greater certainty.
For policymakers, these early forecasts are crucial for:
- Market Intervention: Implementing policies to stabilize prices or ensure adequate supply.
- Trade Negotiations: Informing decisions on import/export quotas and tariffs.
- Strategic Reserves: Managing national agricultural reserves to enhance food and fiber security, not just for cotton, but also for other crops where similar predictive models can be applied, as observed in studies on developmental disparities in agricultural regions.
When complex statistical analysis is needed, whether for individual farm management or large-scale policy evaluation, expert guidance can be invaluable. Our Consulting Services are designed to help practitioners and organizations implement and interpret such advanced methodologies effectively.
Real-World Implications and Future Directions
From Research to Field Application
The insights derived from Dr. Hooda’s work and similar PCA applications have immense potential for practical implementation. Agricultural extension services can train farmers and field agents on simplified data collection protocols. With the advent of mobile technology, data input can be streamlined, and predictive models can be integrated into decision support systems and smartphone applications. Moreover, remote sensing technologies, including drone imagery and satellite data, are increasingly capable of capturing biometrical proxies (like canopy cover, NDVI, plant height estimation) at scale. Integrating these remote sensing data streams with PCA could further automate and enhance the efficiency of yield prediction, moving towards true precision agriculture.
Broader Applicability and Transferability
While this discussion focuses on cotton, the Principal Component Approach is highly transferable to other crops. Maize, wheat, rice, and various horticultural crops exhibit complex interdependencies among growth traits that can benefit from dimensionality reduction. Researchers are continually exploring adaptations of this methodology, potentially integrating it with other advanced machine learning algorithms (e.g., Random Forests, Support Vector Machines) or deep learning models for even more sophisticated predictive capabilities, especially when dealing with high-dimensional and time-series data.
Addressing Challenges and Limitations
Despite its power, the PCA approach is not without its challenges:
- Data Collection Intensity: Accurate biometrical data collection can be labor-intensive and time-consuming, requiring skilled personnel.
- Localized Models: Models developed in one region or for one variety may not be directly transferable to others due to differing environmental conditions, genetic potentials, or management practices. Localized calibration and validation are often necessary.
- Unforeseen Events: While robust, the model might not perfectly account for unforeseen extreme weather events (e.g., late-season hail, severe drought) or sudden pest outbreaks that are not captured by pre-harvest biometrical data. Integrating real-time environmental monitoring and early warning systems can help mitigate this.
Conclusion: Charting a More Predictable Future for Agriculture
The Principal Component Approach to pre-harvest cotton yield estimation, championed by researchers like Dr. B.K. Hooda, represents a significant leap forward in agricultural statistics and data science. By deftly handling the inherent complexity and multicollinearity of plant biometrical data, PCA provides a robust, accurate, and statistically sound framework for forecasting yields. This not only reduces uncertainty for farmers and minimizes market volatility but also empowers policymakers to enact more effective and timely interventions, fostering greater agricultural sustainability and economic stability.
As agricultural practices continue to evolve and technology advances, the integration of sophisticated statistical tools like PCA will become increasingly vital. It underscores a powerful message: by embracing innovation and applying rigorous scientific methodologies, we can chart a more predictable and prosperous future for agriculture. Further research and widespread adoption of such methods are crucial to harnessing the full potential of data-driven decision-making in the field, ensuring that both individual farms and global food systems thrive in an ever-changing world.
B K Hooda
Professor of Statistics & Head, Dept. of Mathematics & Statistics, CCS HAU Hisar.